Data Visualization Help
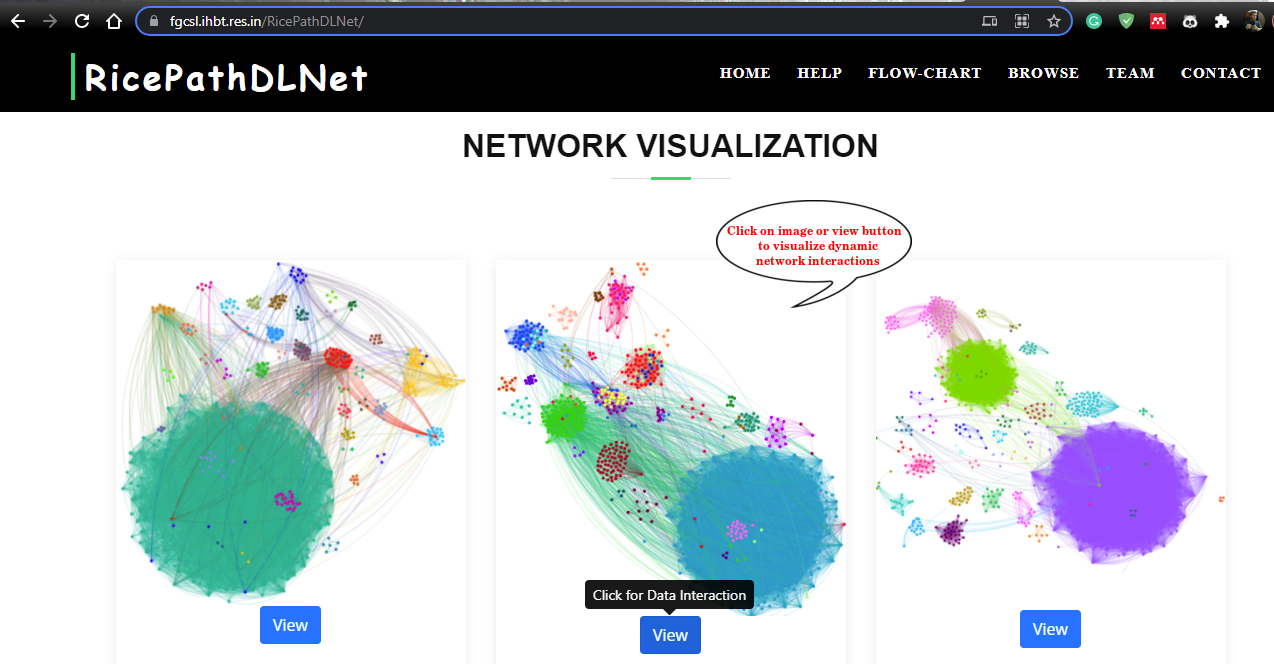
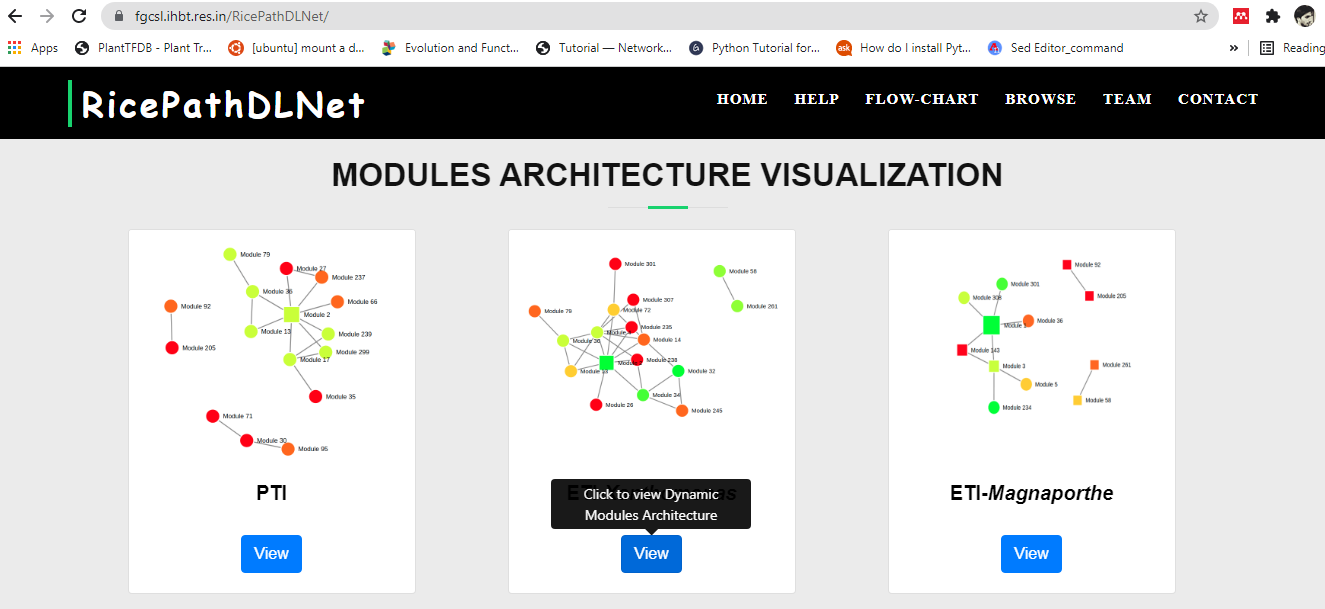
Users can access a dynamic visualisation interface by going to the main page and clicking on the Network Visualization and Module Architecture Visualization panels. You can use your mouse to interact with our Rice modular network models.
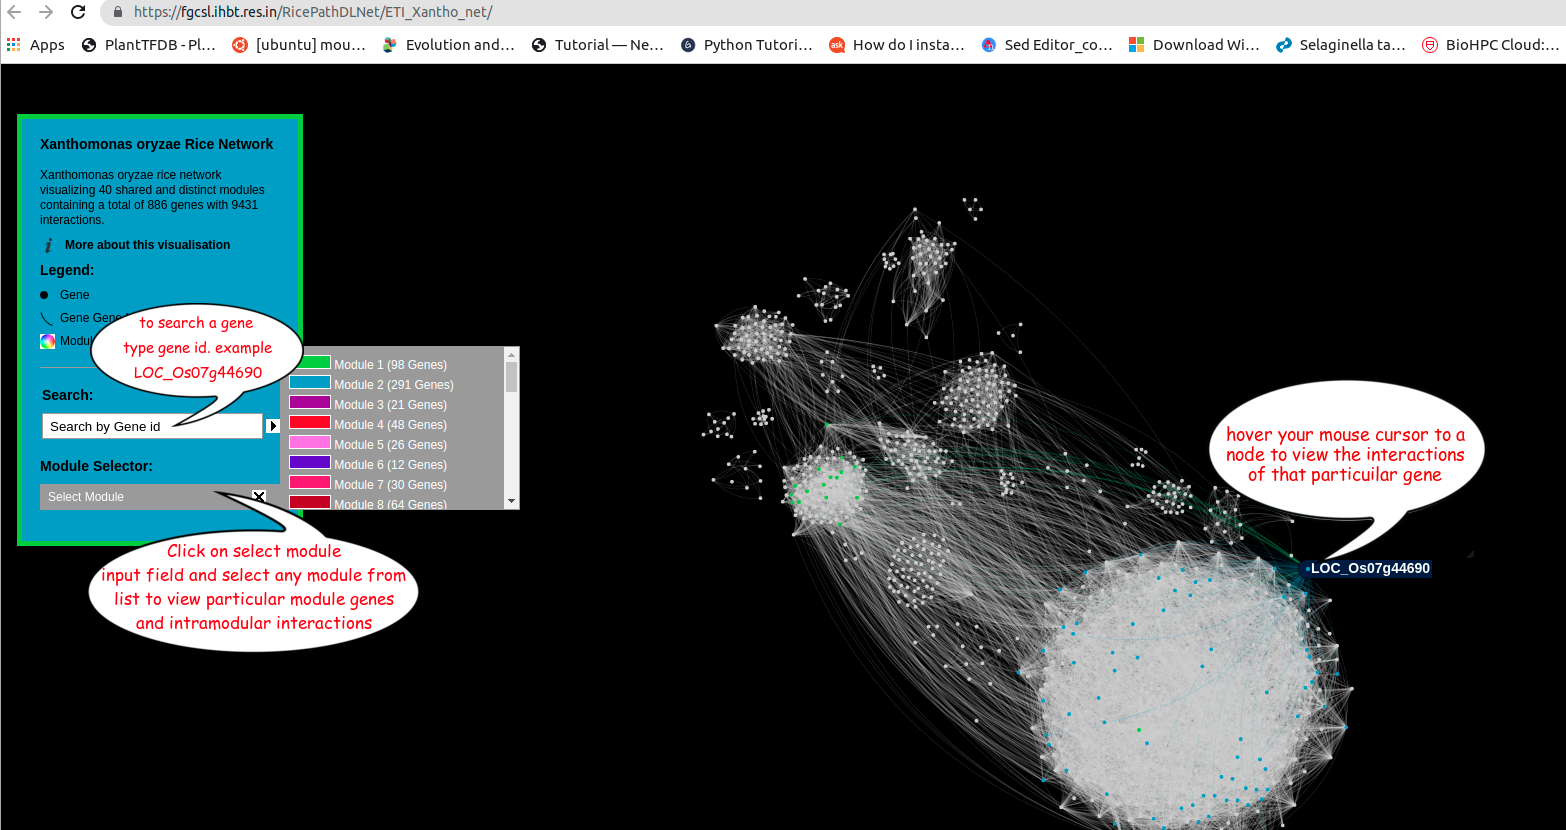
Features:
Use the toolbox on the left side of our network webpage to Search a gene id through search box or module through module selector box
Hover your mouse over a node to see its label (gene id) and neighbours (gene interactions). All nodes except the hover node will be hidden.
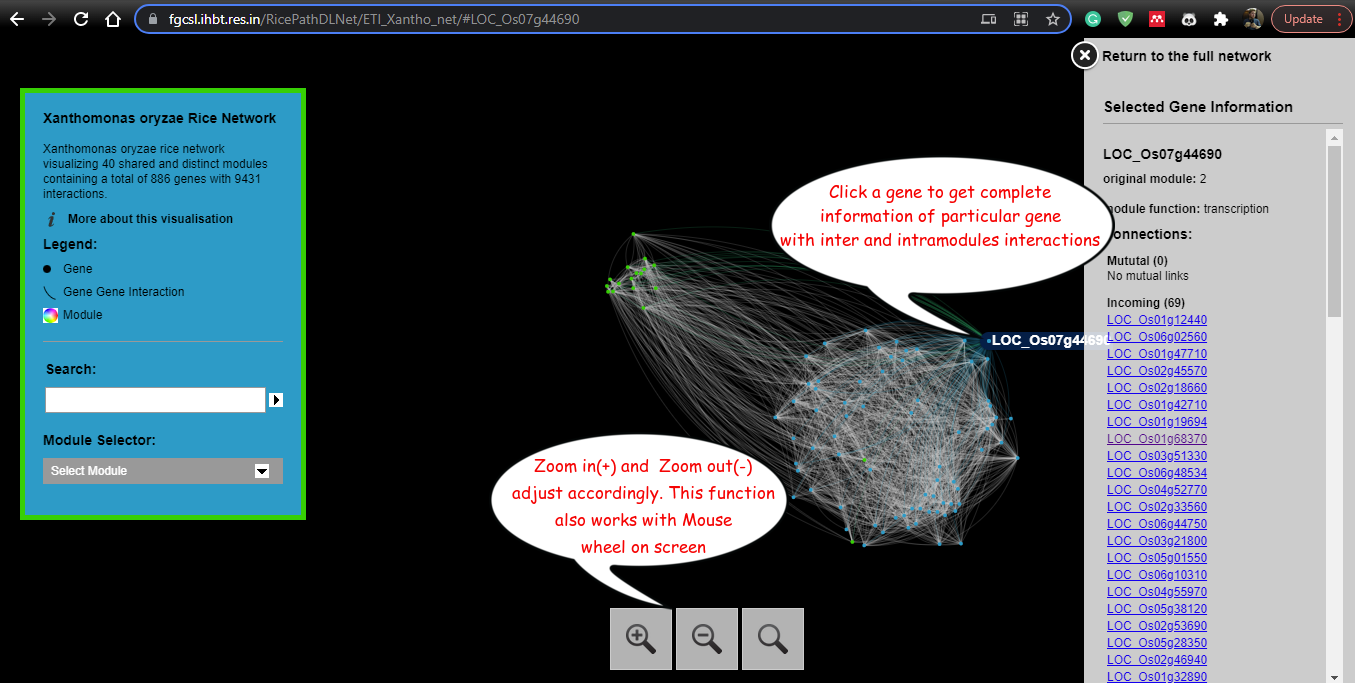
 zoom in zoom out functions through Mouse wheel
Click a node to get more information about particular genes like interactions with other genes
zoom in zoom out functions through Mouse wheel
Click a node to get more information about particular genes like interactions with other genes
Data Browse Help
RicePathDLNet online Visualization repository also provides useful data like List of Unique Genes, Genes Interactions, Proteins fasta file of hub gens and Modules information in tabular format of distinct pathogens.
Genes Information:
Click on colored buttons to view list of information about distinct pathogens genes.
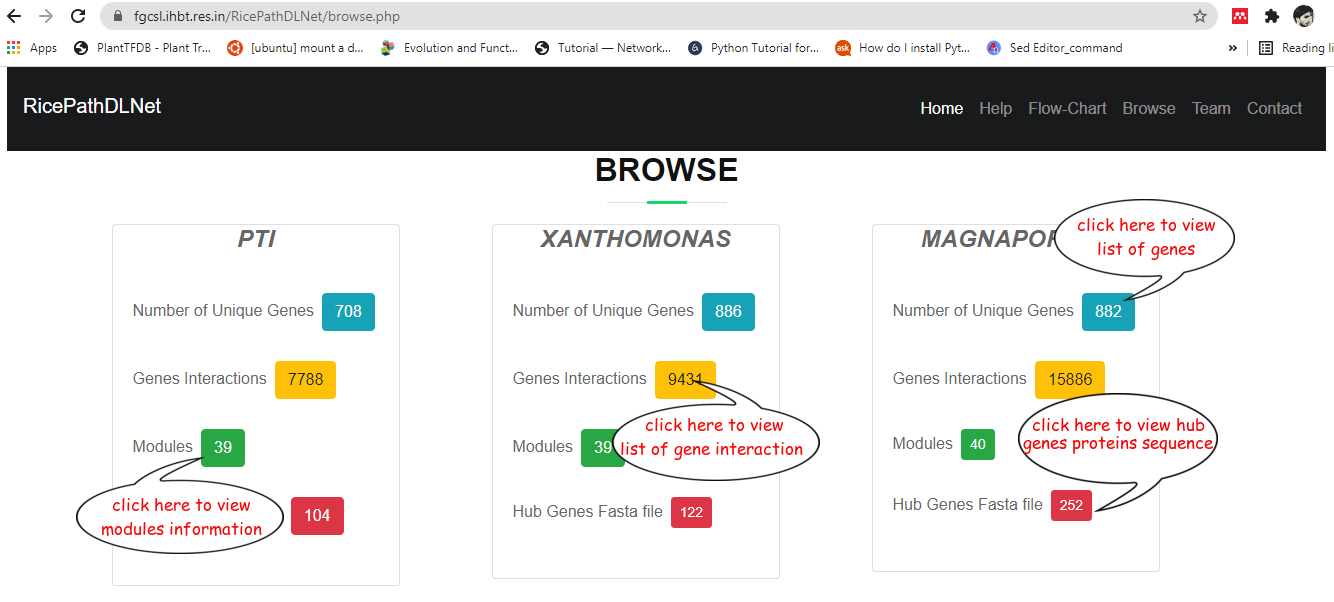
Modules Information:
Click on Modules button will display Modules informations (https://fgcsl.ihbt.res.in/RicePathDLNet/magna_modules.php) and by click on Genes button (last Column) will display a gene list for the particular modules.
